Exxon Mobil is a $400+ billion global energy company focused on upstream, downstream, and chemical operations.

-Seven Year Revenue Growth Rate: 4.3%
-Seven Year EPS Growth Rate: 7.5%
-Seven Year Dividend Growth Rate: 8.2%
-Latest Dividend Increase: 21.3%
-Current Dividend Yield: 2.49%
-Balance Sheet Strength: Extremely Strong
Exxon Mobil boasts one of the strongest balance sheets around, nearly 3 decades of consecutive annual dividend growth, and a modest valuation of under 10x earnings and 18x free cash flow. At the current time, I find Exxon Mobil to be a reasonable dividend stock to buy in the low $90’s as a fairly low yield, moderate growth investment.
Overview
Exxon Mobil (NYSE: XOM) is a well-known and extremely large energy company. The company has upstream, downstream, and chemical components, oil, natural gas, and other businesses, and operations in countries all over the world. So Exxon Mobil is diversified by energy type, location, and industry.
2011 Earnings Summary
Exxon Mobil reported $41.06 billion in net income and $486.4 billion in revenue for the 2011 fiscal year.
Out of this $41.06 billion in net income, $34.44 billion came from upstream operations, $4.45 billion came from downstream operations, $4.38 came from chemical operations, and ($2.22 billion) was spent on corporate and financing activities.
Upstream
Upstream includes exploration, development, and production of energy sources. This segment provides Exxon Mobil’s highest return on capital, at 26.5% in 2011. The company produced 4.5 million oil-equivalent barrels per day, which is a slight increase over 2010.
The company reports that they have been replacing production with additional resources at a rate exceeding 100% in each of the last several years. The 2011 10K, published in early 2012, reports that Exxon Mobil has 16.1 billion barrels of developed oil-equivalent basis in their proved reserves and another 8.8 billion in undeveloped resources in their proved reserves, totaling just under 25 billion barrels of oil-equivalent basis. This includes crude oil, natural gas liquids, bitumen, synthetic oil, and natural gas.
In comparison, the company reported that it produced 4.5 million barrels per day in 2011, which comes out to 1.64 billion barrels per year. The company therefore has large reserves over the next several years and continues to accumulate reserves to maintain production.
Downstream
Downstream includes refining, marketing, power, lubricants, and specialties.
This segment produced $4.45 billion in net income for 2011, which was at the highest level since 2008. Refinery throughput was roughly unchanged between 2010 and 2011 (inching slightly downward), but an increase in margins boosted overall profitability.
Chemical
Exxon Mobil produces a diverse assortment of chemicals from their operations, totaling around 25 million tonnes in 2011. Earnings for 2011 dropped modestly to under $4.4 billion from over $4.9 billion in 2010. Much of the growth over the next decade is expected by the company to come from Chinese demand.
Ratios
Price to Earnings: 10
Price to Free Cash Flow: 18
Price to Book: 2.6
Return on Equity: 28%
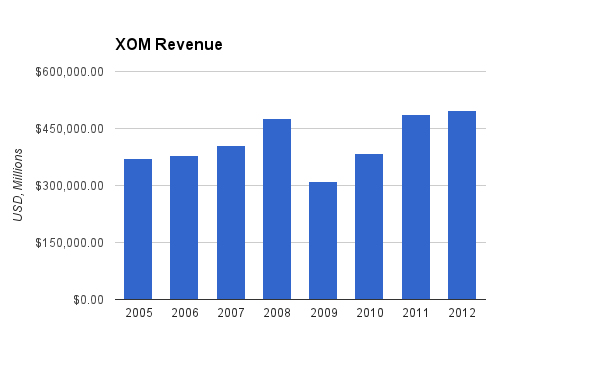
Revenue

(Chart Source: DividendMonk.com)
Revenue grew by an average of 4.3% per year over this period, but was highly erratic due to the financial collapse and recession, which pulled down oil prices and production.
Earnings and Dividends

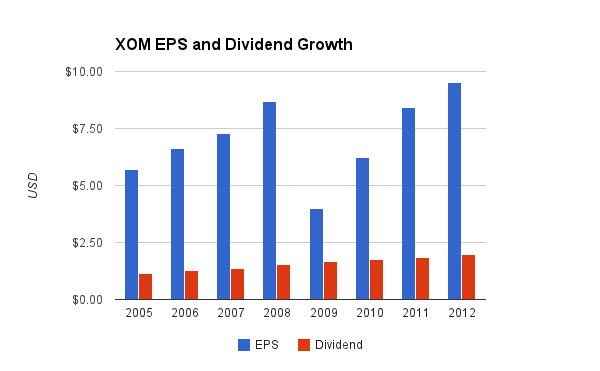
(Chart Source: DividendMonk.com)
EPS grew by 7.5% annually over this period, which like revenue was erratic over this period due to macroeconomic turmoil. The dividend grew by 8.2% over this period, with the most recent quarterly dividend increasing from $0.47 to $0.57, a solid 21% jump in one year.
The dividend yield is only 2.49%, but the payout remains low at well under 25%.
Approximate historical dividend yield at beginning of each year:
| Year | Yield |
|---|---|
| Current | 2.49% |
| 2012 | 2.2% |
| 2011 | 2.3% |
| 2010 | 2.4% |
| 2009 | 2.0% |
| 2008 | 1.5% |
| 2007 | 1.7% |
| 2006 | 1.9% |
| 2005 | 2.1% |
How Does XOM Spend Its Cash?
For fiscal years 2009, 2010, and 2011, Exxon Mobil pulled in a combined operating cash flow of over $132 billion and a combined free cash flow of nearly $52 billion. Over the same period, the company paid out over $26 billion in dividends and around $52 million in net share repurchases. Approximately $16 billion was spent on acquisitions.

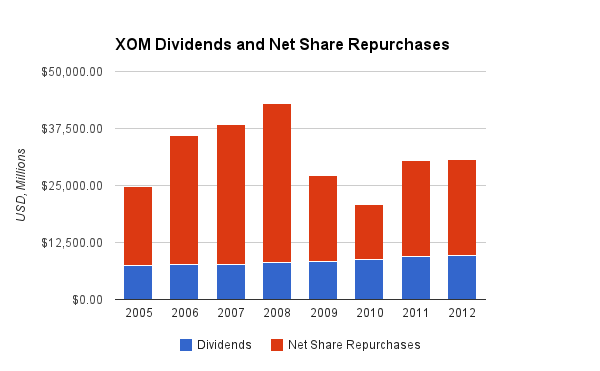
(Chart Source: DividendMonk.com)
This chart shows the combined sum total spent on dividends and net share repurchases each year. The figure for net share repurchases already factors out the value of shares issued. So while XOM’s dividend yield is not particularly high, the total shareholder yield is quite substantial. In 2005 there were over 6.3 billion shares outstanding, and that number is down to under 4.8 billion now, and continues to decrease.
The company’s use of cash to repurchase that volume of shares does not delight all income investors, however.
On one hand, due to the volatile nature of energy prices, the company has to keep the dividend yield fairly low if management intends on maintaining their long streak of consecutive dividend increases. The repurchases do create shareholder value in the form of increasing corporate ownership of each remaining shareholder, which therefore accelerates EPS and dividend growth. Over the period from 2005 to now, company wide net income grew by 3.2% annually on average, while EPS grew by 7.5% over the same period. Similarly, from 2005 to the current time, the total dividend payment to shareholders grew by 3.8% per year on average while the per-share dividend grew by 8.2% over the same period. So, the share repurchases are responsible for making the per-share annual growth figures more than 4% greater than the corresponding company-wide figures.
On the other hand, as can be clearly seen by the above chart when comparing it to a stock price chart over the same period, Exxon Mobil buys back more shares when share prices are high, because that’s when they have more cash. XOM stock prices peaked into the $80’s and $90’s during 2007 and 2008, which is when XOM spent the most money buying shares. Then, when stock prices dropped to the $70’s, $60’s, and even $50’s in 2009 and 2010, the company spent significantly less money buying back their stock. This isn’t unique to XOM; the majority of companies follow this trend of buying back more stock when their prices are high. So while these buybacks do create shareholder value, they do not do it in a mathematically optimal way. Plus, while the company must keep the dividend yield moderately low to avoid potential cuts when oil prices fall, as 2009 results show, even with a particularly dramatic macroeconomic event the company came nowhere near needing to cut its dividend. The yield could be boosted to 3% without almost any increase in dividend risk.
Balance Sheet
Exxon Mobil is one of only four companies with an AAA credit rating. Total debt/equity is under 10%, and intangible assets make up a fairly negligible portion of the asset base. One year’s worth of net income is equal to nearly 3x the current sum of long term debt and short term debt.
The interest coverage ratio is well over 100 because the company has very little debt and a very low interest rate on that debt.
Overall, Exxon Mobil’s balance sheet is about as rock solid as they come. Large oil companies face catastrophe risk at any given time and must therefore be prepared to self-insure if necessary.
Investment Thesis
Exxon Mobil reports its expectations each year regarding global energy growth. The latest projections propose that global energy demand will increase 30% from 2010 to 2040, which already takes into account continued emphasis and improving technology around energy efficiency. The company expects oil usage to grow by 0.7% annually and natural gas usage to grow by 1.6% annually. They expect coal usage to slowly reduce, and for nuclear and renewable energy sources to grow at the quickest rates while remaining fairly small contributors to the overall energy demand. OECD countries are expected to remain essentially flat in total energy usage (with increased demand being offset by improving efficiency), while non-OECD countries are expected to count for all of the total increase in energy demand.
Exxon Mobil has more than 30 projects planned to come online after 2015, along with dozens of projects coming online between now and that year. The company has a larger scale than most of its peers and is capable of taking on the largest projects. Furthermore, the vertical integration between their Upstream, Downstream, and Chemical segments allows the company to cut costs, because portions of the infrastructure are combined.
Risks
Exxon Mobil exists as a company that continually needs to extract non-renewable resources. Over the long term, their pickings have an eventual limit, and in the meantime, countries are critical about their own energy supplies and greater amounts of the easy-to-reach energy deposits are being used up. This leaves the more difficult unconventional resources to tap over time.
The company has years of proved reserves and a good history of replenishing production with new sources, but their overall margins have long-term downward pressure if they’re going to have to extract harder-to-reach sources over time, unless they can successfully pass on the prices to customers with an increase in commodity prices for hydrocarbon sources, and these prices are largely out of their control.
Shorter-term risks include the ever-present but unlikely risk of a major catastrophe and the associated litigation that would accompany it, as well as the potential for continued global macroeconomic weakness or political action. The company’s profits declined considerably when oil prices fell in the last recession.
Conclusion and Valuation
The company’s geographic diversification and significant proved reserve base allows the company to operate strongly for the relevant future.
Based on the Dividend Discount Model, the trailing twelve months of dividends ($2.08), combined with an expectation of 8% long-term dividend growth and a 10% discount rate leads to a fair price of $112. However, if the expected dividend growth rate is reduced to only 7% as shown by the fair price calculator, then the estimated fair price would drop considerably to $74.
Overall, the current price at under $92 appears fair. The P/E of under 10 can be deceptively low to some, but the P/FCF is a more robust 18 and shows the company is not particularly undervalued. The low dividend yield and sensitive estimates around the discount rate and dividend growth rate result in a wide margin of fair price calculation error, but this is tempered by the company’s size, diversification, and consistency. Large portions of the total shareholder returns come from dividends and buybacks rather than core growth, and the sum of the dividend yield and the dividend growth rate mildly exceed 10%.
Full Disclosure: As of this writing, I am long XOM.
You can see my dividend portfolio here.
Strategic Dividend Newsletter:
Sign up for the free dividend and income investing newsletter to get market updates, attractively priced stock ideas, resources, investing tips, and exclusive investing strategies:


I like XOM a lot. My only concern is the price of oil. Many have argued, and I would agree that we are going to see lower oil prices here in the near future. With that said, I am curious to see how the market reacts to large cap stocks like Exxon. I plan on purchasing some on a pullback.