I never choose investments based solely on stock valuation because that could stop me from buying amazing stocks while my money idles on the sidelines needlessly. However, I do use stock valuation tools to identify where I’ll get the best return.
There are many ways to assess a stock’s value. I prefer to keep it simple. First, a quick look at both the dividend yield and the PE history to see if there are significant variations that might suggest a buying opportunity. Then, compare the DDM and the Refinitiv Value Score with those of other companies in the same industry to find the stock trading at the best value. Of course, the strength of a company’s dividend triangle always carries more weight in my decision than valuation.
Here’s a quick look at four stock valuation tools I use regularly. They are available on the DSR stock cards for the companies we follow, and in our stock screener.
Dividend Yield History
A simple, yet effective tool is a company’s dividend yield history. The past 5 years of dividend yield history gives a good idea of what the company’s average yield should be. When a company progresses as expected, i.e., continuous growth, stable business model, etc., the stock price and the dividend likely to progress on a similar trajectory. In other words, the yield is similar year after year.
The dividend yield changes for a few reasons:
- The yield increases when the dividend increases at a faster pace than the stock price, and when the stock price declines while the dividend increases or remains intact.
- The yield decreases when the dividend increases more slowly than the stock price, or when the dividend is cut.
Below, we see why Telus saw its yield go up in the last year: poor stock price performance since mid-2022 while the dividend kept increasing at a consistent pace.
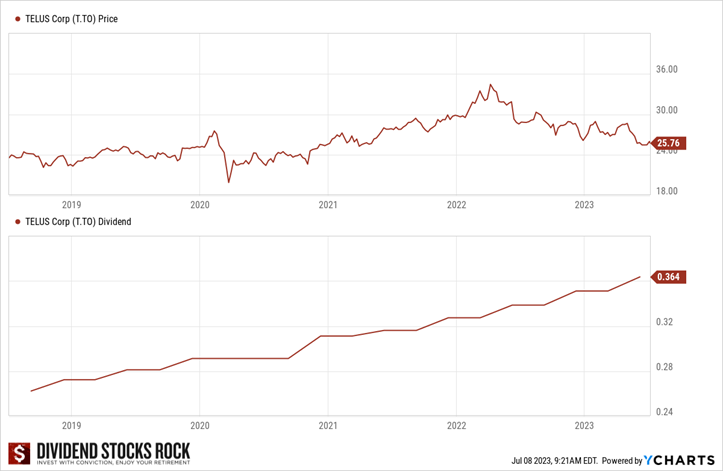
A yield increase could point to a buy opportunity. While not foolproof, dividend yield hints at when a good time to invest in a company might be.
I also check the 5-year average yield. Telus offering a higher forward yield (6.10%) than its 5-yr average (4.85%) might be a good deal, but by no means a certainty!

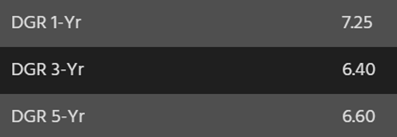
The dividend growth rate over one, three, and five years reveals that Telus steadily increases its dividend each year at a similar rate.
Yield history is a far from perfect valuation tool. Many factors can cause a higher yield, and it doesn’t always mean it’s a good deal; for example, a company might lack growth vectors or use more of its earnings to keep increasing its dividend due to weaker results. You must find the context around any dividend yield increase or decrease.
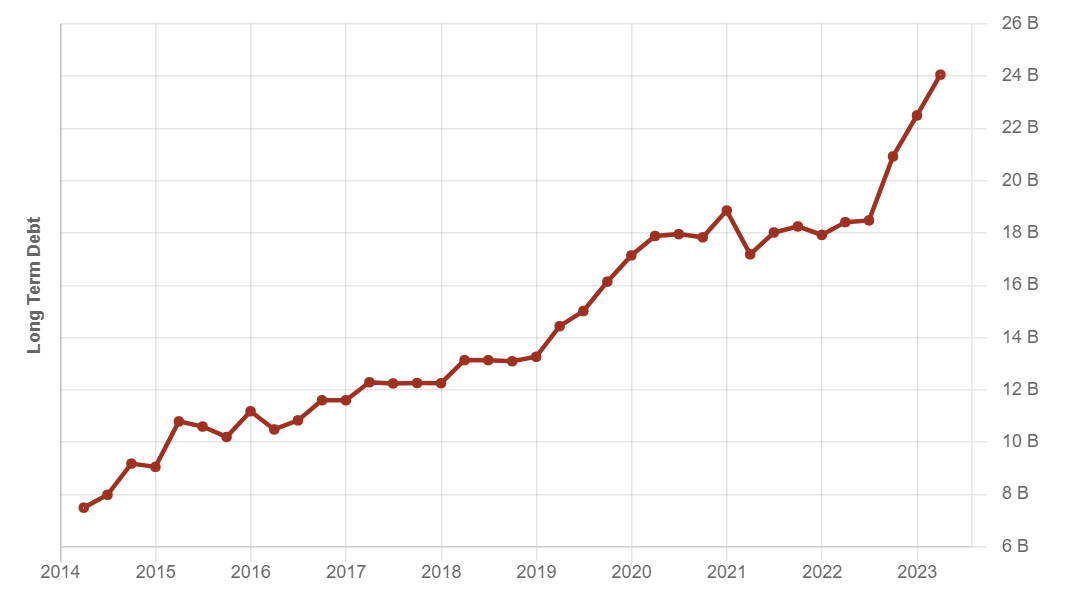
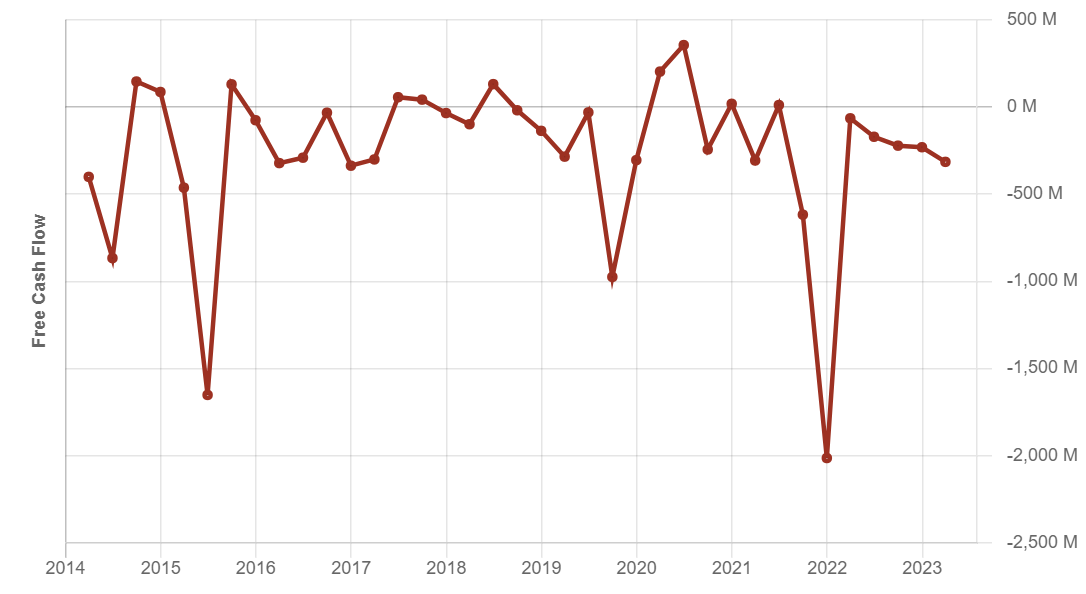
For Telus, the market is concerned about its rising debt in these times of higher interest rates. Telus currently spends more than it’s generating cash flow and its debt is rising.
Want more details about analyzing and choosing great stocks, even before you look at their valuation? Download our free workbook.
PE Ratio History & Forward PE
Like the dividend yield history, the history of the stock price to earnings ratio tells a story about the company’s valuation. A decreasing PE ratio is not always good news, for example, earnings growth slowing down could lead investors to want to pay less for the stock, lowering the ratio.
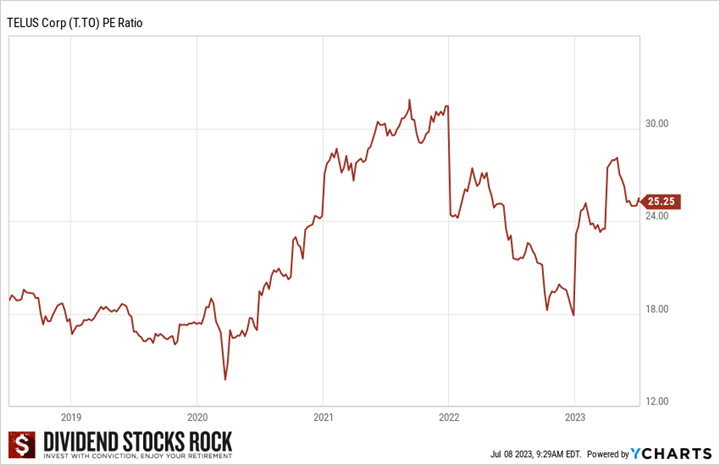
Telus’s 5-year erratic PE ratio history doesn’t tell us much. However, we see that the forward PE is in line with the average of the past 5 years.

For both the dividend yield and the PE history, a strong valuation is not an indication of a buy or sell opportunity, but rather an invitation to investigate further.
Dividend Discount Model (DDM)
Of all stock valuation tools, the DDM is particularly relevant for dividend growth stocks. It’s used to determine the intrinsic value of a stock based on future dividends that grow at a constant rate. It gives you the value to pay today for stock that will pay and hopefully grow its dividends in the future. The DDM:
- Works well for stable companies with a yield above 3%.
- Does NOT work well for low yield, high growth companies, like Apple.
- Is extremely sensitive to the dividend growth and discount rates. A 1% change can make a stock look overvalued or like the bargain of the year.
The DDM stock value only factors in future dividends. Future capital growth, which you should expect from good stocks, is not considered. I like the DDM to compare two or more companies from the same sector or industry that are similar in many respects to find the “best” dividend grower among them.
Since the DDM considers value solely from future dividends, a company with a 0.75% yield won’t look like great value. However, low yield companies often perform the best in total return.
Refinitiv Value Score
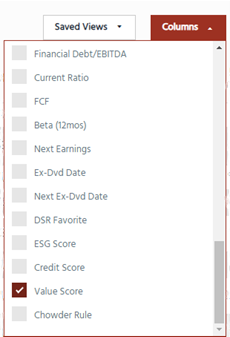
I like the Refinitiv StarMine Value Score. This powerful tool combines and weighs these six metrics for a company:
- EV/Sales
- EV/EBITDA
- P/E
- Price/Cash Flow
- Price/Book
- Dividend Yield
Then, it compares them to other companies on the market and gives a company a score from 1 to 100. Higher scores indicate stocks with the best value.
Never select a stock by Value Score alone. Why? A very high score could easily be a company whose stock price recently fell, but whose metrics, taken out of context, still look good.
A good example is BlackBerry. In 2012, it was in complete freefall as its famous device was rapidly losing market share to Apple’s iPhone. Its metrics, however, were stellar; in fact, all its metrics used in the Refinitiv Value Score, except the dividend yield, were among the best on the market:
| FINANCIAL METRICS | BLACKBERRY (BB.TO) | APPLE (AAPL) |
| EV/SALES | 0.32 | 2.72 |
| EV/EBITDA | 1.47 | 7.57 |
| P/E | 3.53 | 11.54 |
| PRICE/CASH FLOW | 24.95 | 12.61 |
| PRICE/BOOK | 0.725 | 4.928 |
Using the Refinitiv Value Score, buying BB.TO would have been tempting. All metrics made BlackBerry look cheaper and the better deal, except the price/cash flow ratio, the red flag! Without a thorough analysis prior to looking at valuation metrics, you wouldn’t understand why BB was “so cheap”.
Like the DDM, I use the Refinitiv Value Score to compare companies in the same industry.
In closing
Other stock valuation tools include the Discounted Cash Flow Analysis, akin to the DDM, but assessing the value based on future cash flow, and ratios such as Price to Book, Price to Sales and Price to Cash Flow.
Regardless of the method used, valuation tools are best used to compare companies you’ve already analyzed. To make buying decisions, never rely on valuation metrics exclusively!


